
Affects of n
By: Russell Lawless
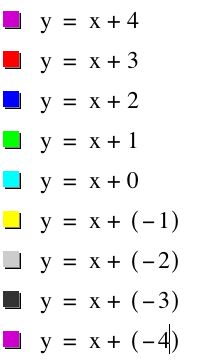
I chose to do number 1 of Exploration 0 for my extra write up. We will be looking at the equation y = x + n where -4 ≤ n ≤ 4.
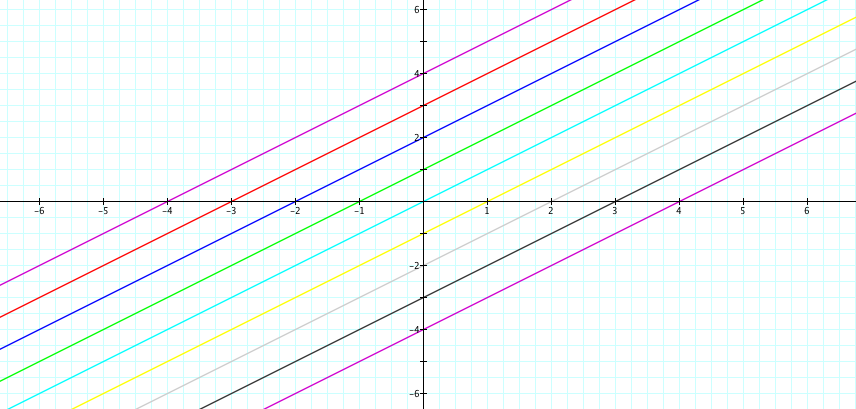
If a student graphs these equations all at once, they might not be able to see any commonality between the functions. The only thing they might think about are that the lines are parallel or have the same slope. They might just graph the functions and be done with it too if they are not told to find any commonality or similarities between each graph. The benefit of a student doing these one by one is that the student can see that the graph is moving down by one for every decrease of n. Also if they are doing it one by one they can spend more time in seeing similarities among the graphs. Below is an animation of y = x + n where -4 ≤ n ≤ 4.
The purpose of the animation is to help students understand that the equation y = x is translated by multiple values of n. One of the things that might make the equation even better would be a dot on the graph that will show the correct translation of y = x. The reason I say this is because using the animation or even graphing the functions, a student could get confused on whether or not the function is translated vertically or horizontally.